I’m very grateful to everyone who has tried out the new matrix tool. If you missed the announcements, you can read the previous blog post and watch the webinar.
Overall, the matrix provides a convenient at-a-glance look at shared DNA amounts for a group of people. If you specify relationships, it will also flag any relationships where the amount shared is out of range for that relationship in the Shared cM Project.
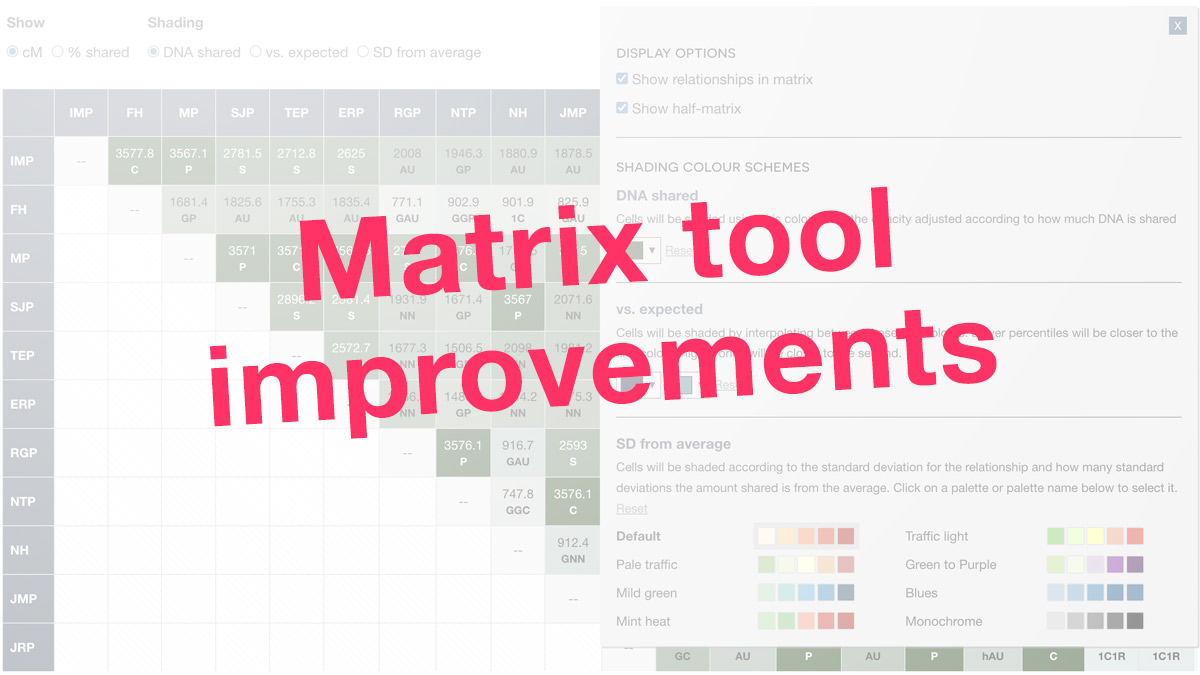
Since I launched the tool, there have been many great suggestions for improvements, and I’ve just released an update that includes several of these. You can see the latest updates by refreshing at dnapainter.com/tools/matrix/example or by logging into your DNA Painter account and visiting the Matrix tab under Tools and WATO.
Shading for standard deviations
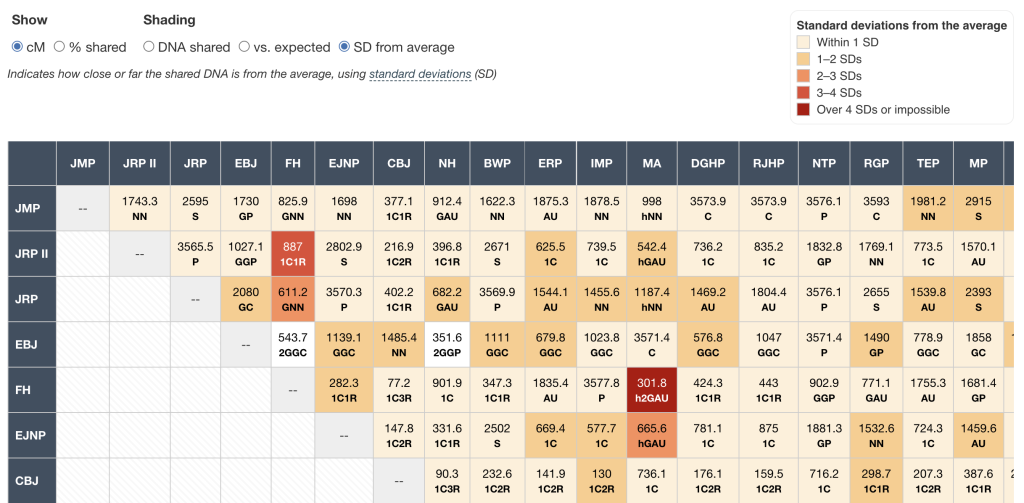
Before this update, you could adjust the shading by DNA shared and vs. expected. You can now also select Standard deviations from average.
A standard deviation is a calculation that shows how spread out a set of numbers is. These calculations exist for every relationship in the shared cM Project. This means the tool can output exactly how far an amount shared is from the average for that relationship. This makes it easier to spot matches that are unusually high or low for the relationship.
If you click a name on the left, you see an overlay focusing on just that tester. When SD from average is selected, the chart in the overlay uses standard deviation rather than percentile data, showing if a relationship is above or below the average. The standard deviation data also appears within the relatives table tab.
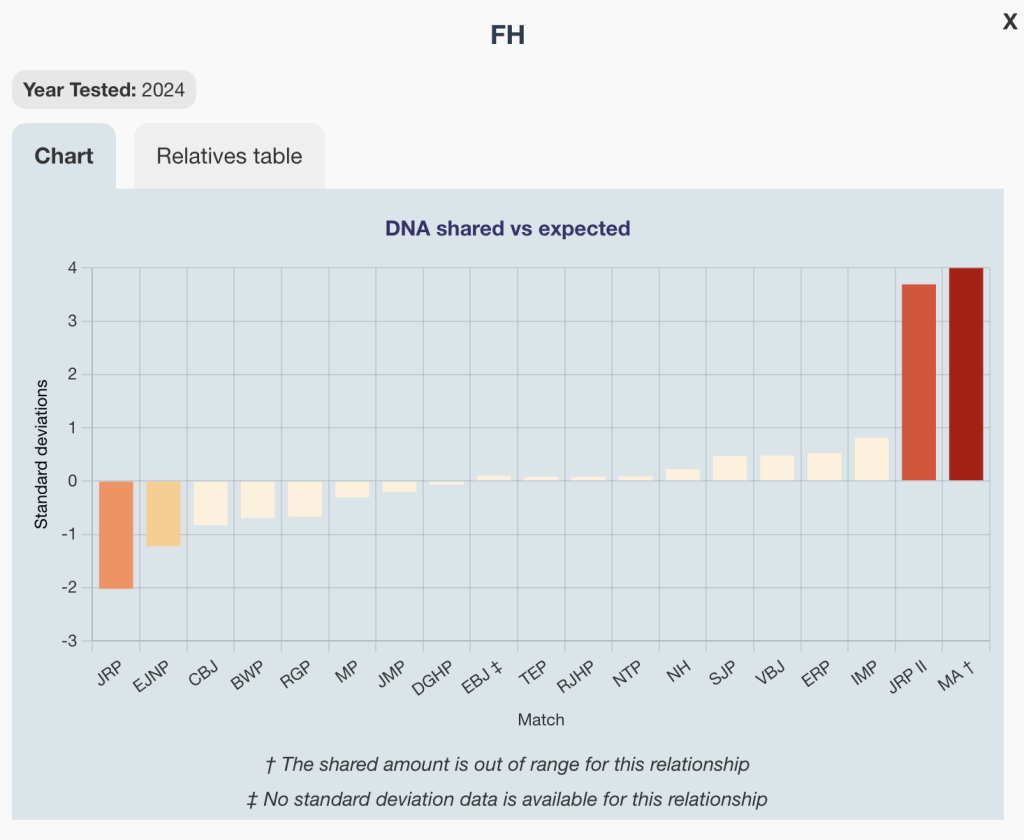
This can help correct mistakes. In this case, I had actually entered one of the amounts on the right incorrectly.
New settings panel
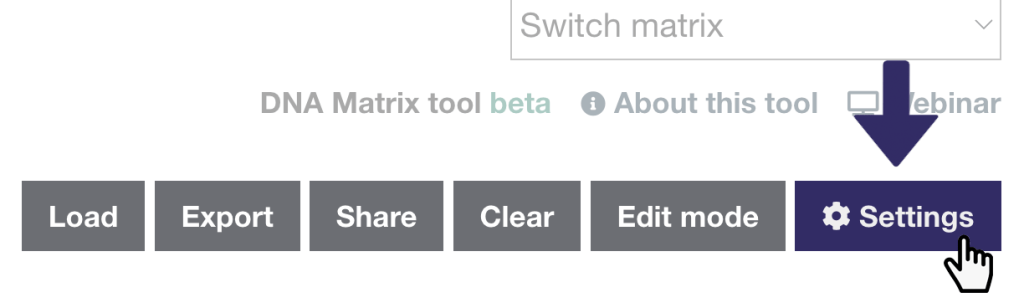
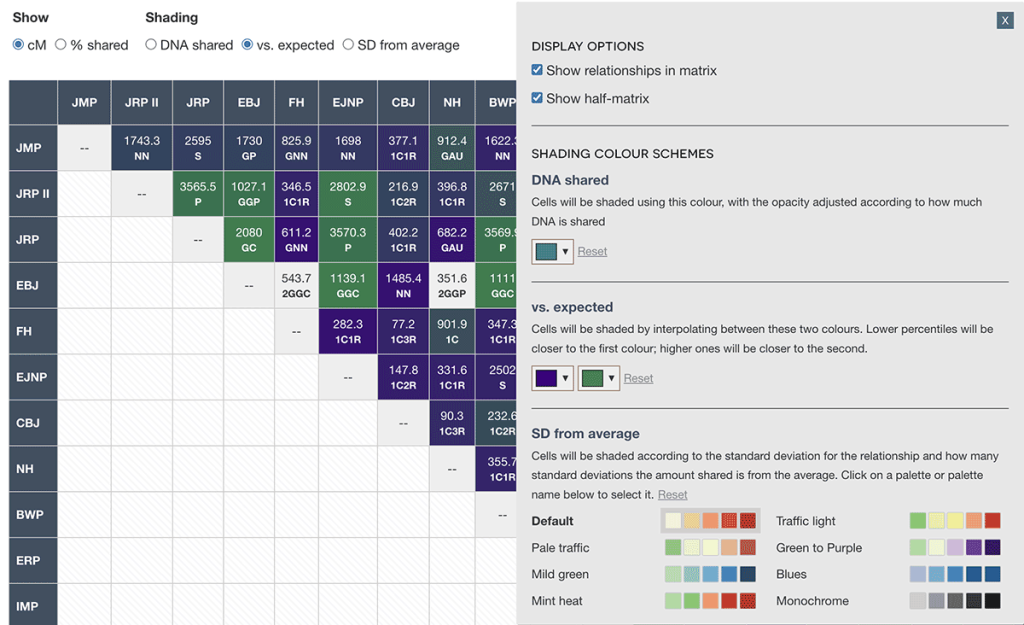
On the right, you’ll see a new Settings button.
Once you open this, you’ll see checkboxes for two new display options, as well as controls allowing you to specify the colours used for shading.
Any settings you adjust will be saved in your browser’s local storage so that you’ll see them every time you use the tool. If you want to revert to the default colours, just click Reset.
Show relationships in matrix
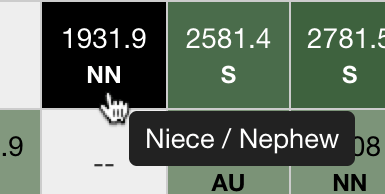
When this box is checked, an abbreviated relationship name will be displayed in the matrix under the shared cM amount. To see the full relationship name, just hover.
Show half matrix
By default, a matrix will display the data for each relationship twice: once on each tester’s row. You can check show half matrix to reduce this visual clutter and just display it once.
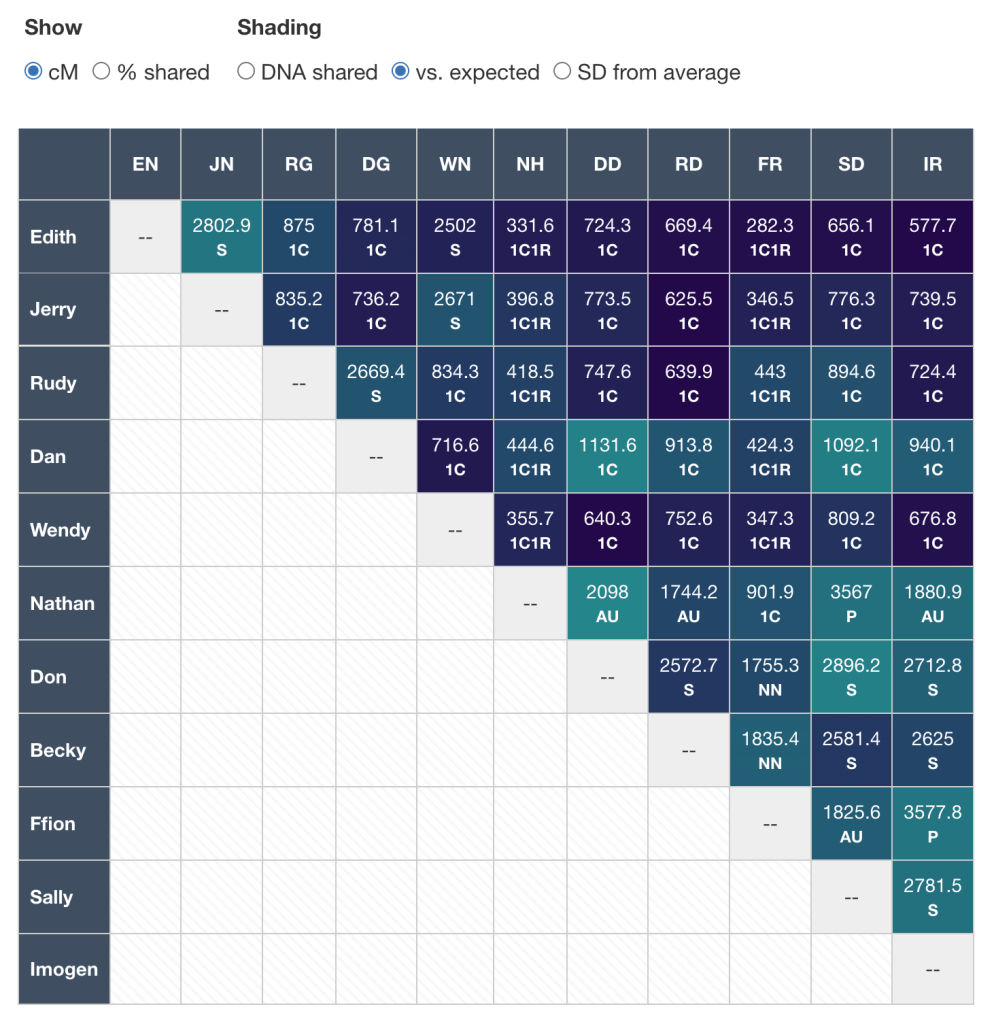
As a reminder, if you click on a column header, this will move that tester to the top and sort the other testers based on the current shading mode.
- For example, if you clicked on DD in the matrix pictured above, Don (aka DD) would appear as the first row, followed by the other testers in order of how much DNA they share with Don vs. what is expected for that relationship
- If the shading was set to DNA shared, the other testers would appear in order of how much DNA they share with Don
- If the shading was set to SD from average, the other testers would appear in order of how many standard deviations from the average their relationship with Don is (essentially, how ‘average’ the amount shared is)
This provides a nice easy way to access a particular person’s shared amounts when show half matrix is checked.
Shading colour schemes
You can now adjust the colours for each shading option:
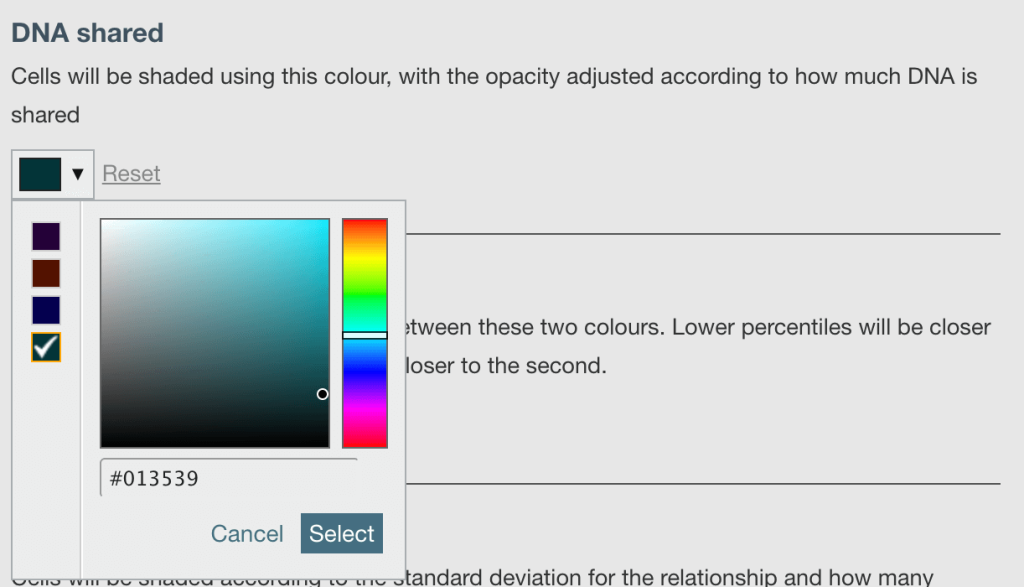
DNA shared
The shading for DNA shared is based on a single colour, and the shade used is that colour, but with the opacity adjusted based on the percentage shared. To change the colour, you can:
- Click on a suggested colour on the left
- or click on the gradient and hue areas
- or paste in a hex code
Then click Select, and the new colour will be applied immediately
vs. expected
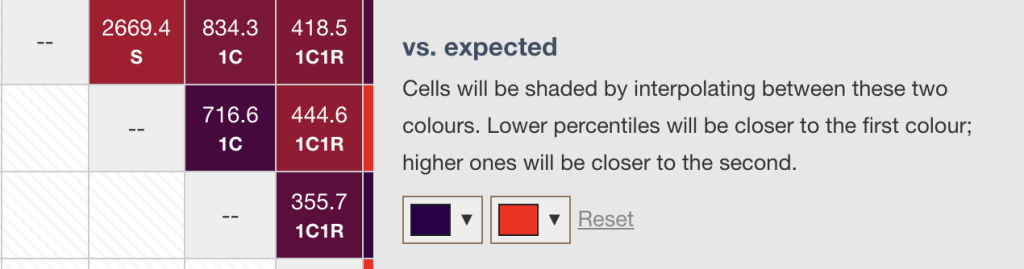
For vs. expected, the shading works by interpolating between two colours using the percentile (where the amount shared fits alongside what others reported sharing for this relationship). For example, if the two colours are dark blue and red, the shade used will be dark blue if the percentile for the relationship is 0 and red if it’s 100. If it’s 50, the shading will be somewhere in between.
You can set the low and high colours in the settings just as for DNA shared.
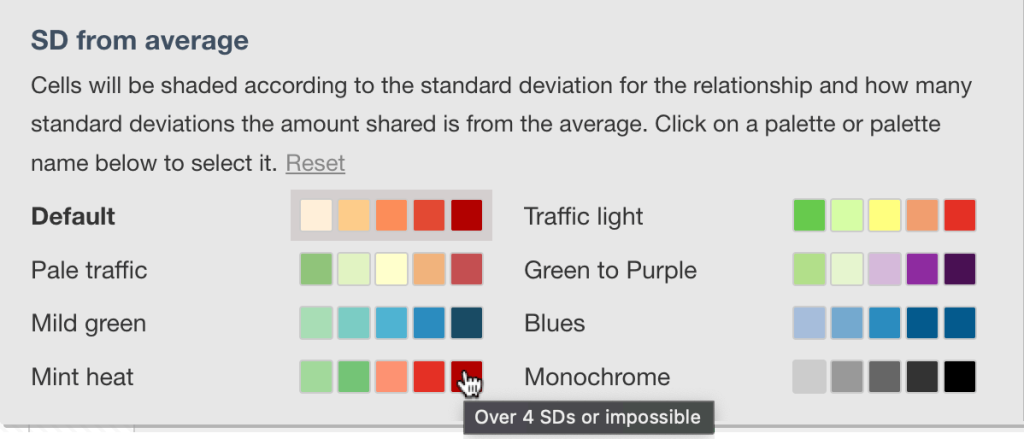
SD from average
For standard deviations, the shading is based on a colour scheme. You can choose from eight pre-set palettes. Hover over a colour to see what it represents in the palette.
Edit mode improvements
To reach Edit mode, click the button in the top navigation or at the bottom right below the grid. In edit mode, you can:
- Change the order of testers by dragging and dropping using the ⋮⋮ handle to the left of the tester name
- Delete a tester by clicking × to the right of their name and confirming
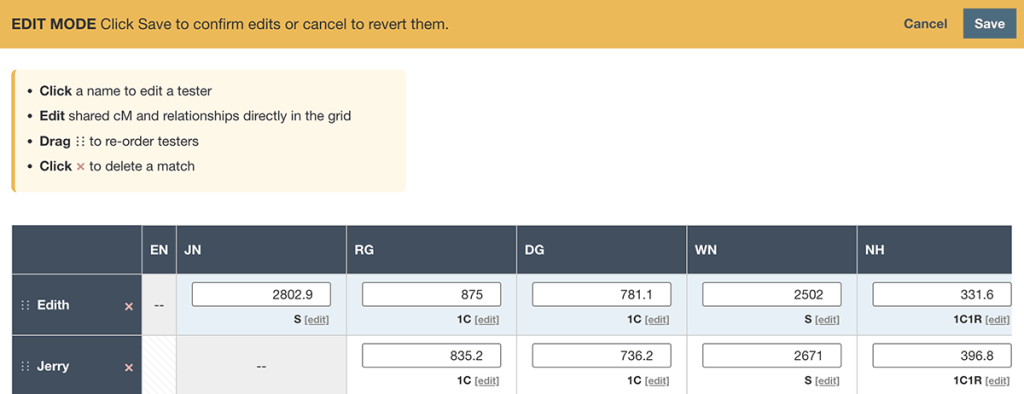
As a reminder, when you’re in Edit mode, all updates are provisional until you click Save. You can hit cancel to revert them. By contrast, if you add or edit a tester when not in edit mode, your updates will be saved immediately.
You can also now add, edit, or delete relationships as well as shared cMs for all testers. In order to take advantage of the vs. expected (percentile) and standard deviation features, you need to tell the tool what the relationship between the testers is. To add a relationship:
- Click + add relationship
- You’ll see a blank field that says Type a relationship
- Once you enter a few letters, matching relationships will show below, and you can click on the one you want
- After you’ve clicked, the relationship will be added
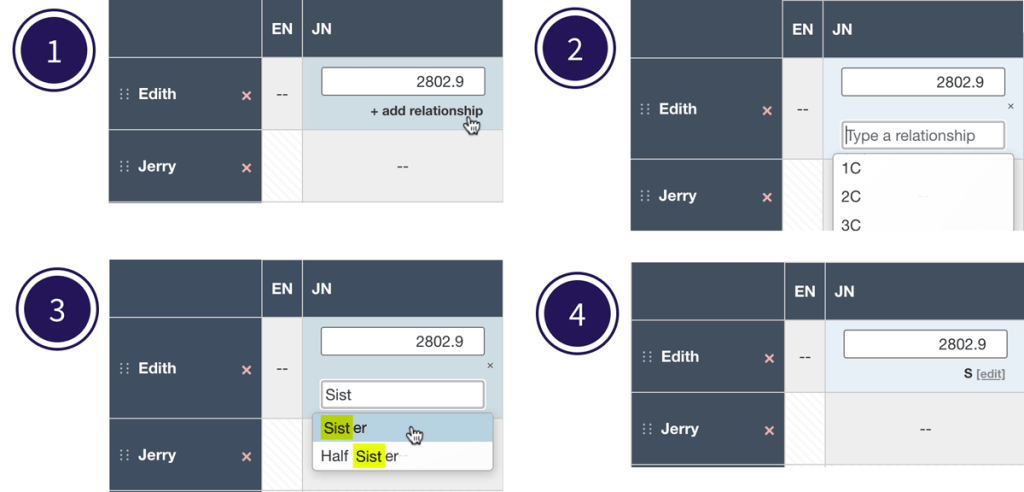
The same steps apply for editing a relationship. Always click on a matching relationship in the dropdown to ensure the tool understands the relationship. To delete a relationship, just remove it and hit Enter or click somewhere else on the page.
Import/export improvements
As described previously, there are a few different ways you can import data into the matrix tool. This latest release includes a few enhancements:
- Users importing CSV files can now optionally include relationship information alongside shared cM
- To do this, use the | (pipe) or ~ (tilde) character as a delimiter; for example, a cell might contain 667|Great-Aunt / Uncle as opposed to just 667
- You can download a sample file and a list of all relationships from the Load menu
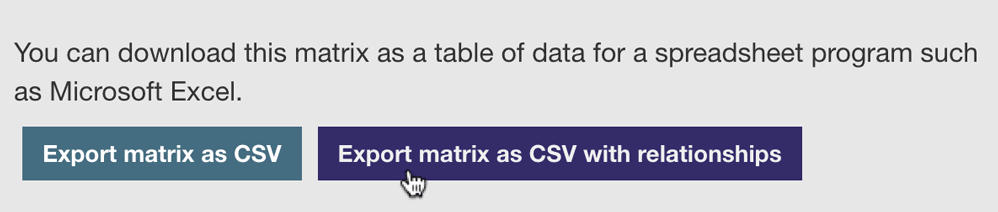
- There’s also now an extra button allowing you to export a matrix with any relationship data in it.
Finally, if you load a file in from the Load menu while you’re in edit mode, you can click cancel and the matrix will now revert to its previous state.
Thank you
Huge thanks to everyone who has provided feedback and suggestions, including Anthony Redgrave, Bert Baert, Blaine Bettinger, Christine Harris, Colleen Kennedy, Erica Millar, Louis Kessler, Martin Prochazka, Nicole Dyer, and Peter Sjölund. Thanks!
Contact info: @dnapainter.bsky.social / jonny@dnapainter.com